Network Centrality
Gallery | | Links: Full Screen
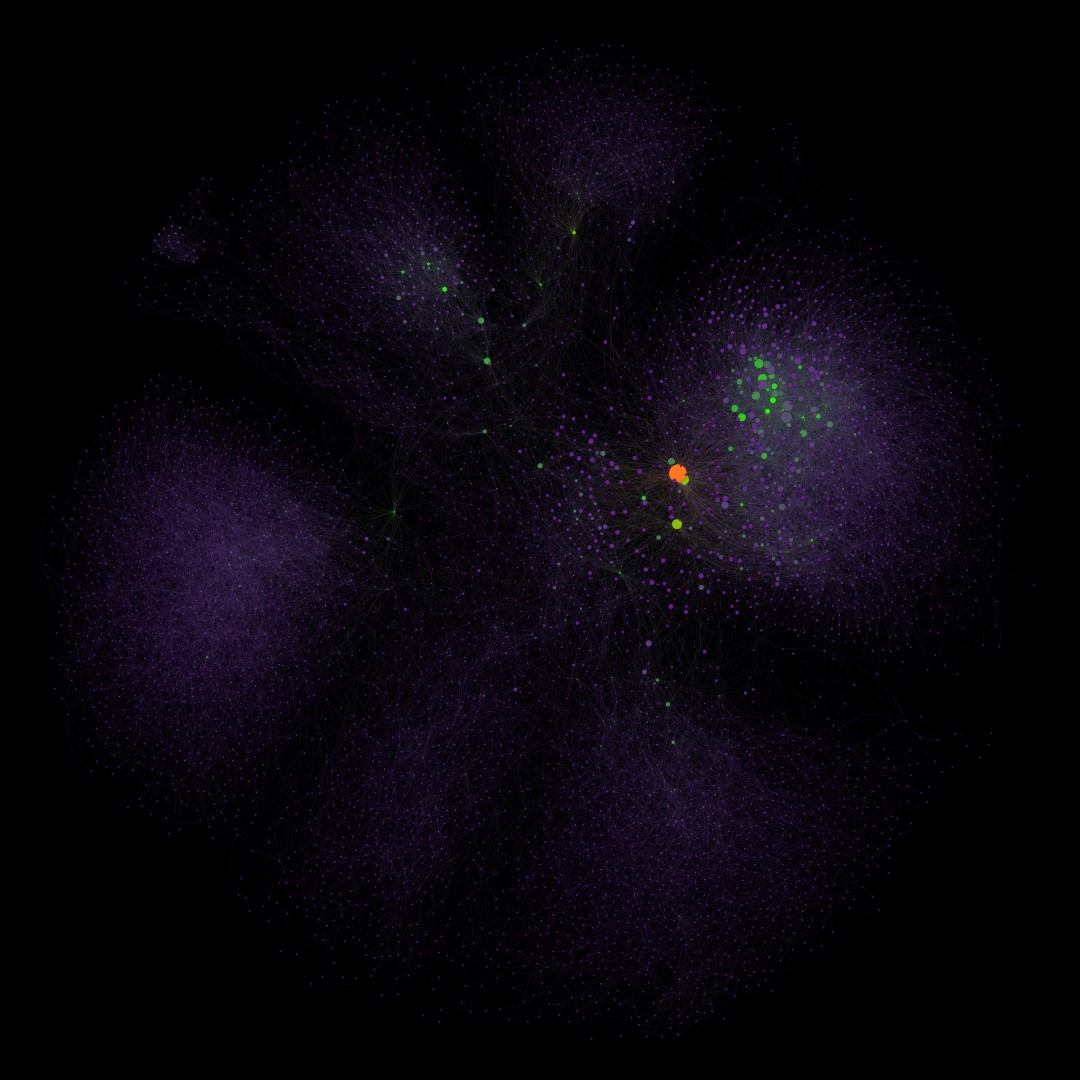
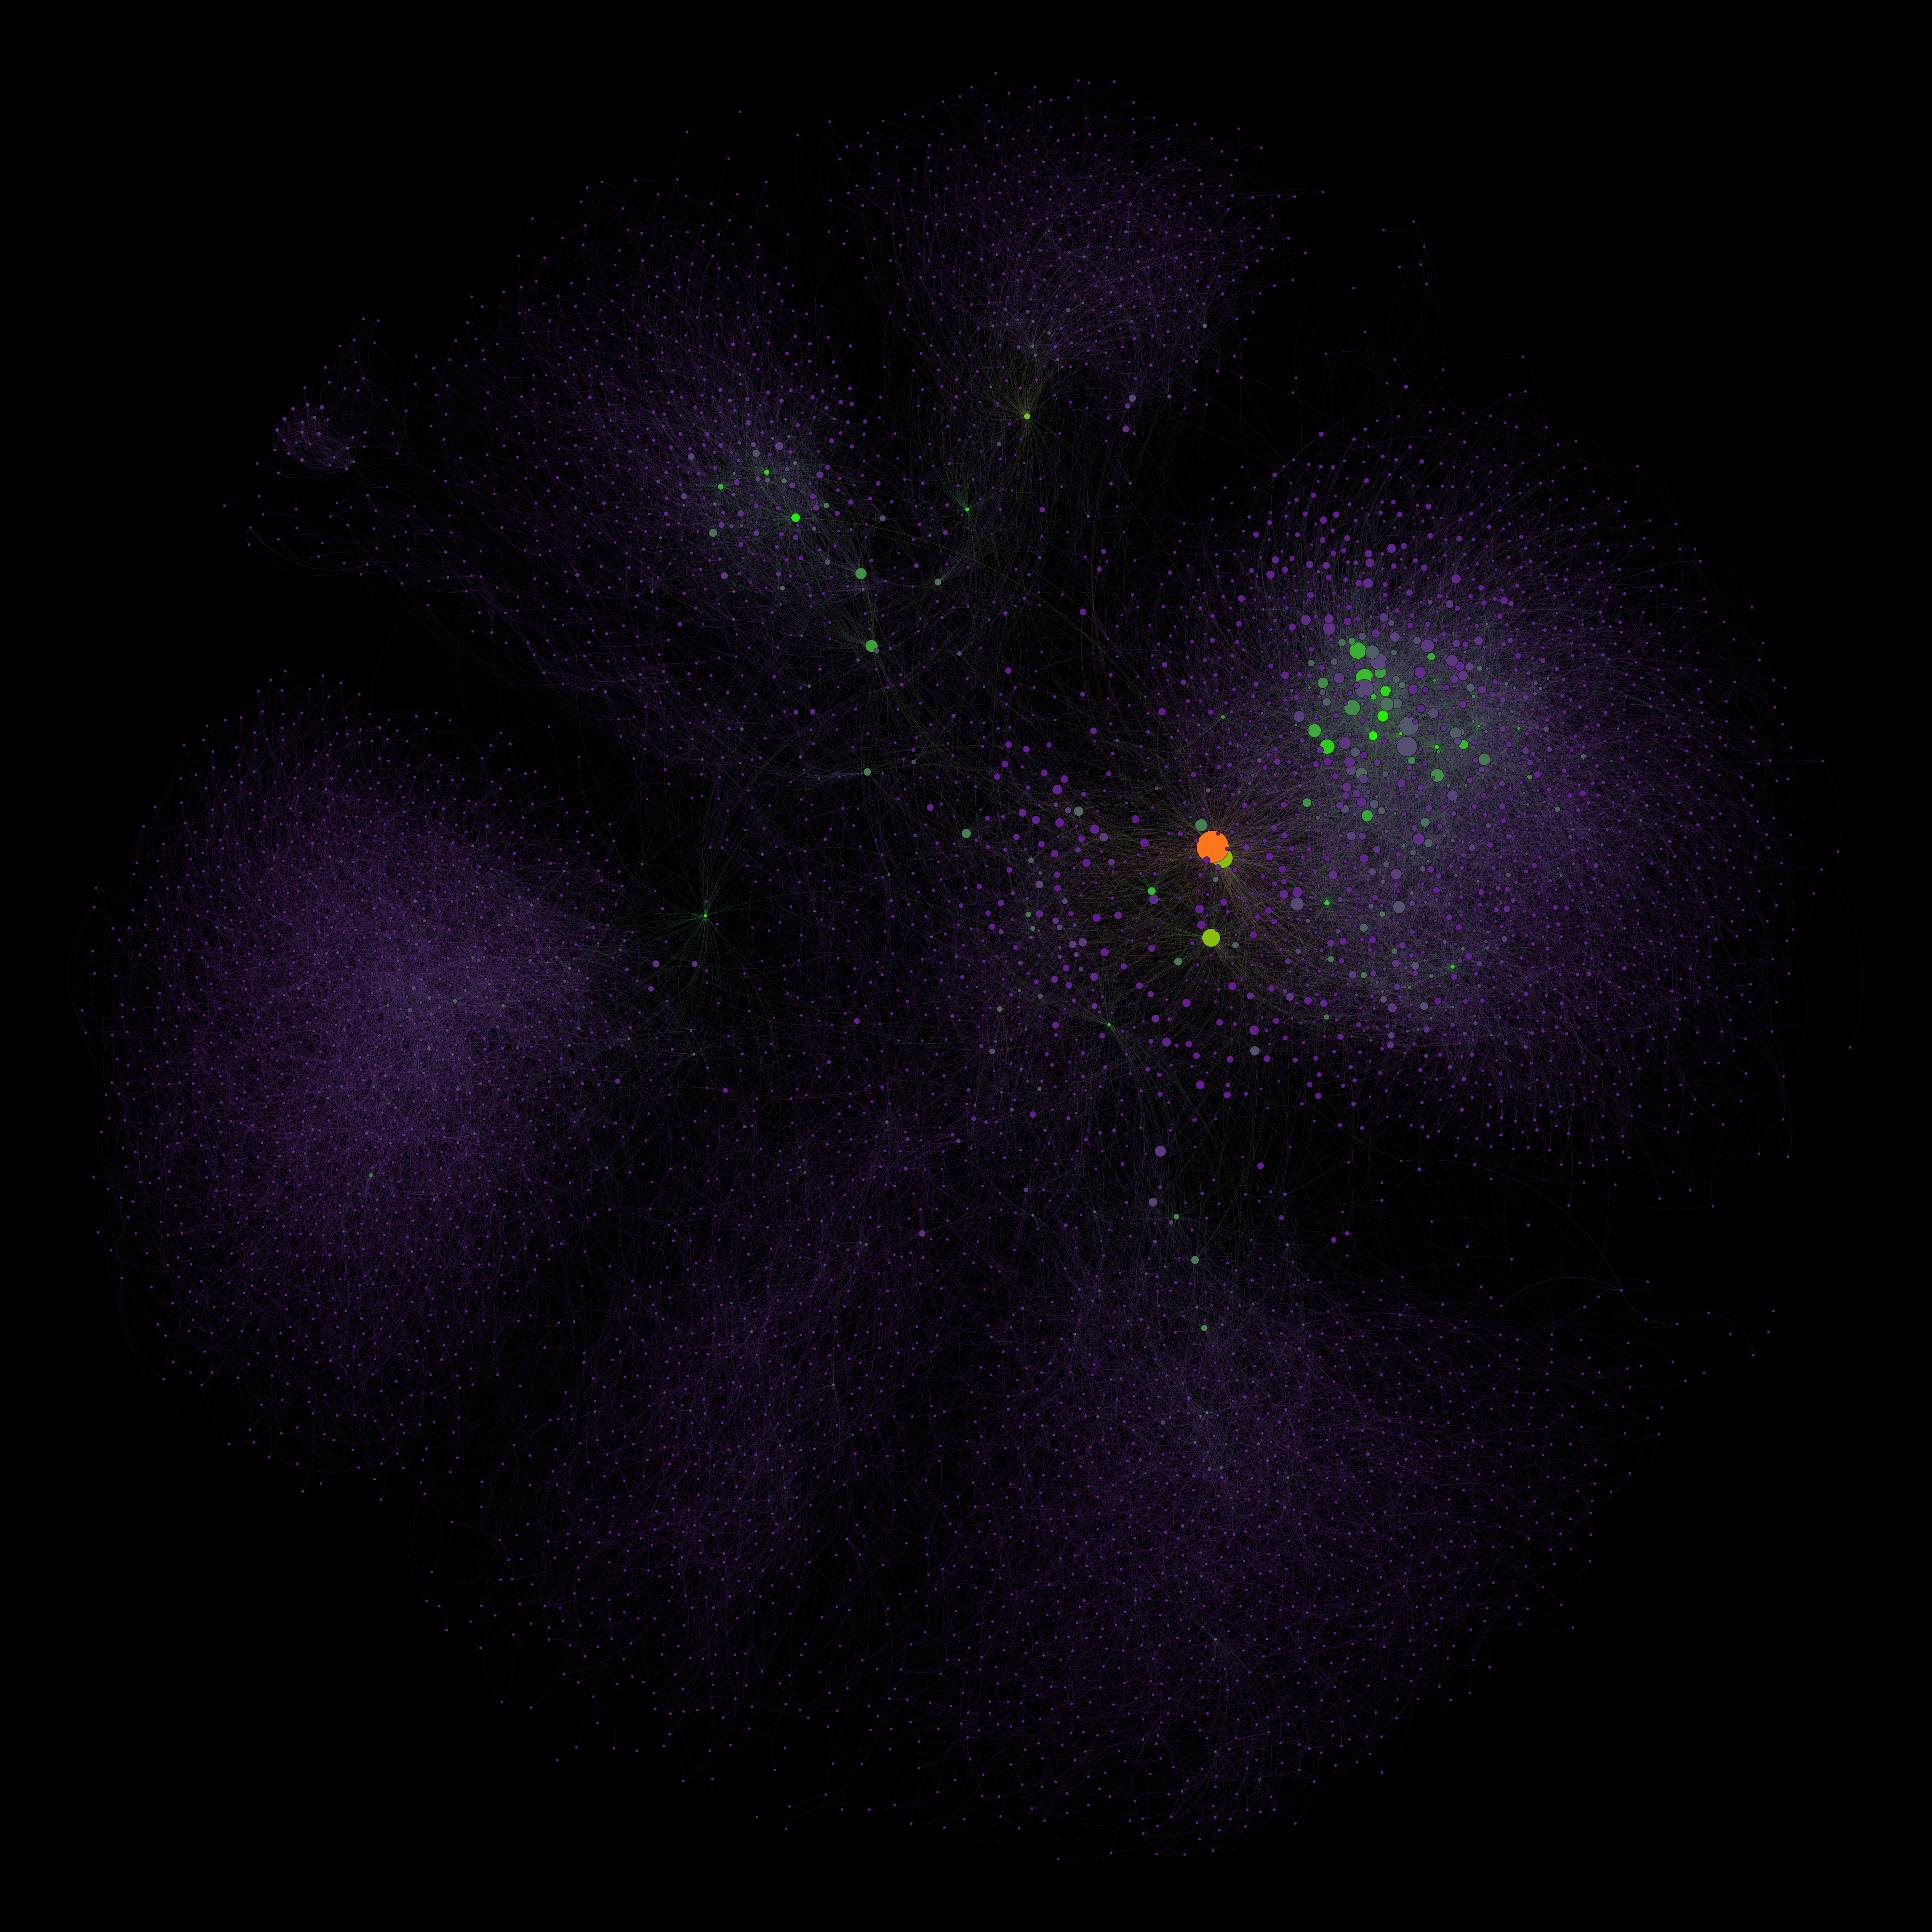
This image displays a network map using the eigenvector centrality measure and clustering coefficient to highlight the centrality of the network. Node size is used to represent eigenvector centrality, with larger nodes indicating higher centrality. Node color represents clustering coefficient, with orange nodes having high clustering coefficient, green nodes having average, and purple nodes having low. The visualization shows that there are only a few nodes with high eigenvector centrality, and most nodes have low centrality. Similarly, there are only a few nodes with average clustering coefficient, with most nodes having either high or low clustering coefficient. The nodes are arranged into six macroclusters, with one of them being the densest and having the most number of orange and green nodes. Overall, this visualization provides a detailed view of the network’s centrality and clustering properties, allowing viewers to gain insights into the most important and tightly connected nodes in the network.